{% if webmention.content %}
{{ webmention.content }}
{% else %}
{{ webmention.title }}
{% endif %}

我如何动动小手就让 CI 时间减少了 10 分钟
Stupidly effective ways to optimize Rust compile time
虽然经常有逸闻抱怨 Rust 编译速度臭名昭著地慢,但我们的项目 RisingWave 在经过前人比如(skyzh,BugenZhao)的一些努力后,编译速度并不算慢,特别是我自从用上 M1 的 Macbook Pro 后,编译速度根本不是问题,全量 debug 编译也就两三分钟。
然而随着时间推移,CI 里加了越来越多的东西,越来越臃肿了。现在 main workflow 需要大概 40min,PR workflow 需要大概 25min30s。虽然并不算特别慢,但是可以体感到比以前变慢了不少。
于是我前两天心血来潮,决定花点时间研究一下能不能再优化一点编译速度。
令我非常震惊的是,没想到存在着一些非常简单的方法,动动小手就产生了惊人的成效。感觉完全可以用 low-hanging fruits、silver bullet 甚至是 free lunch 来形容🤯。
P.S. 很推荐 matklad(IntelliJ Rust 和 rust-analyzer 的原作者)的 blog:
我用到的大部分方法这里面都有讲到,而且他讲的清晰明了。如果没有另外说明,那么文中的 quote 都来自这里。
本文算是我的实践记录,或者大概可以也当成一个 tl; dr 版。每一个优化点都带上了相应的 PR,可以结合 commit history 点开每个优化点前后的页面对比效果。
P.P.S. 优化完的结果:main 最快 27min,PR 最快 16min,大多在 17-19min 左右。
可供参考的数据、图表
Build times are a fairly easy optimization problem: it’s trivial to get direct feedback (just time the build), there are a bunch of tools for profiling, and you don’t even need to come up with a representative benchmark.
前两天在研究 profiling,那现在提到要优化,当然应该看看有没有什么数据、图表看看,找到瓶颈在哪里再来优化。
CI waterfall & dag graph
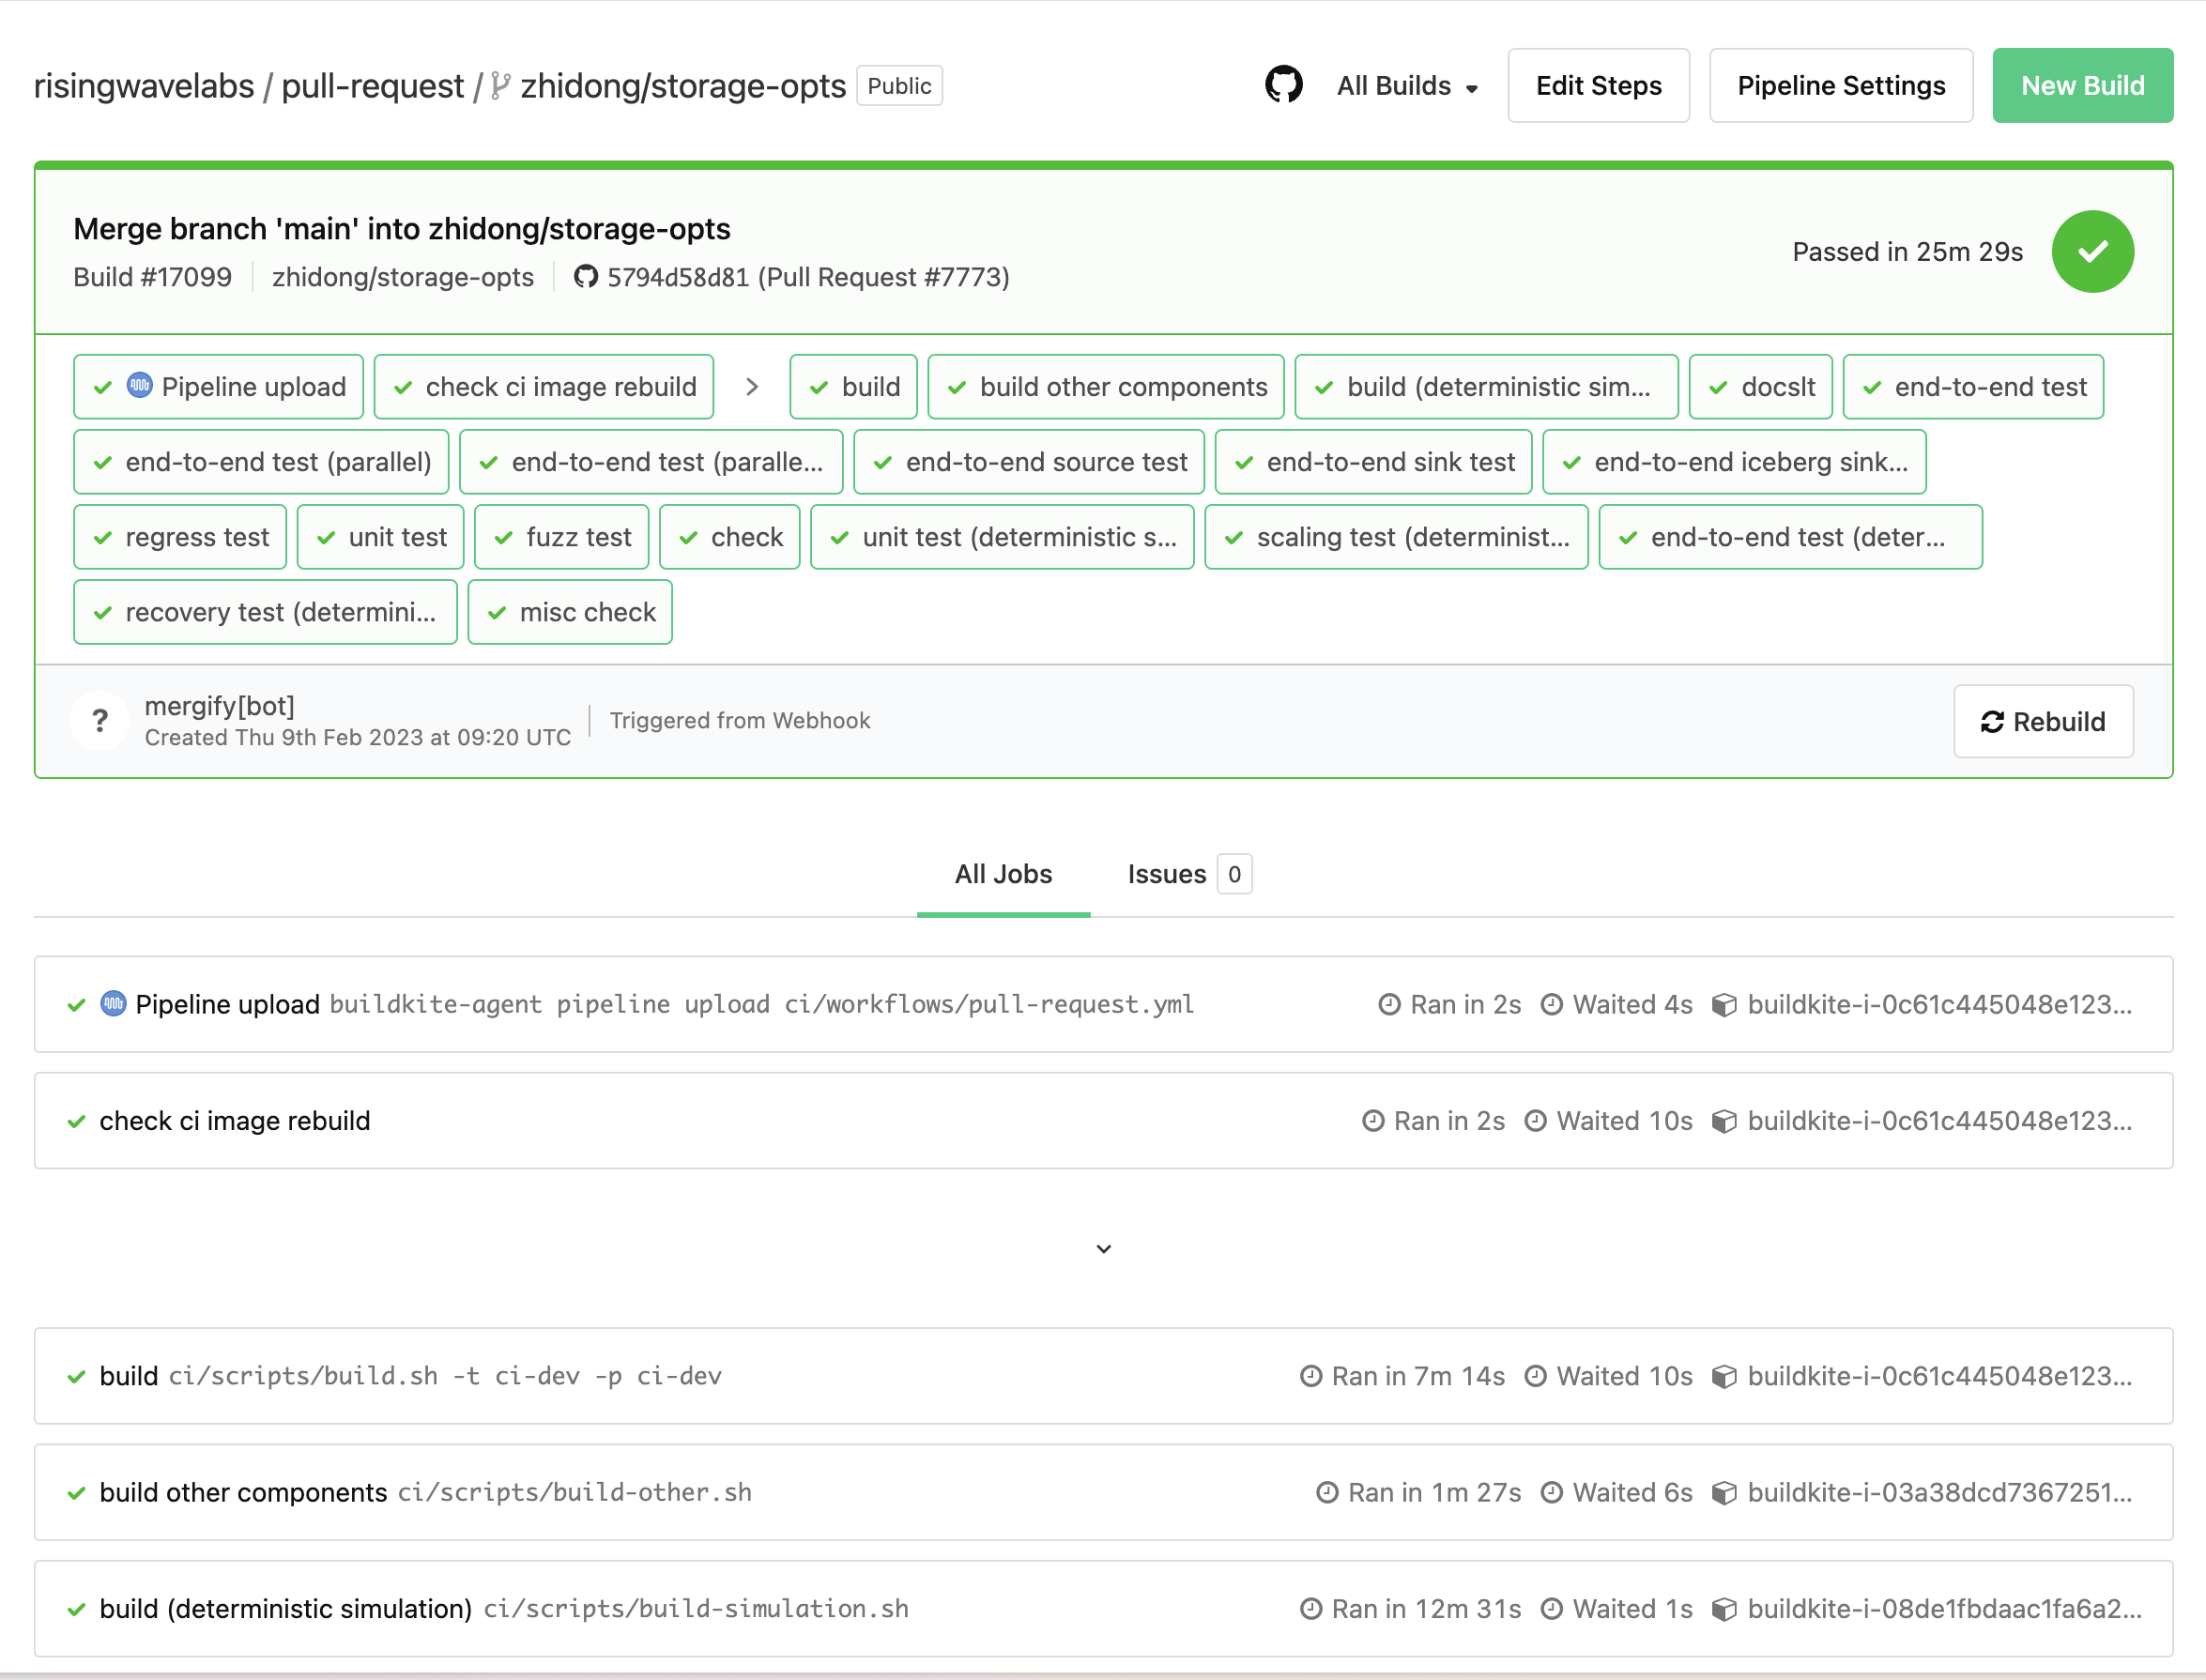
我们的 CI 用的是 Buildkite,正常点开一个页面(例如 Build #17099)长这样:
Buildkite 有两个非常好用的隐藏页面,分别是在 /waterfall 和 /dag 里,可以看到:
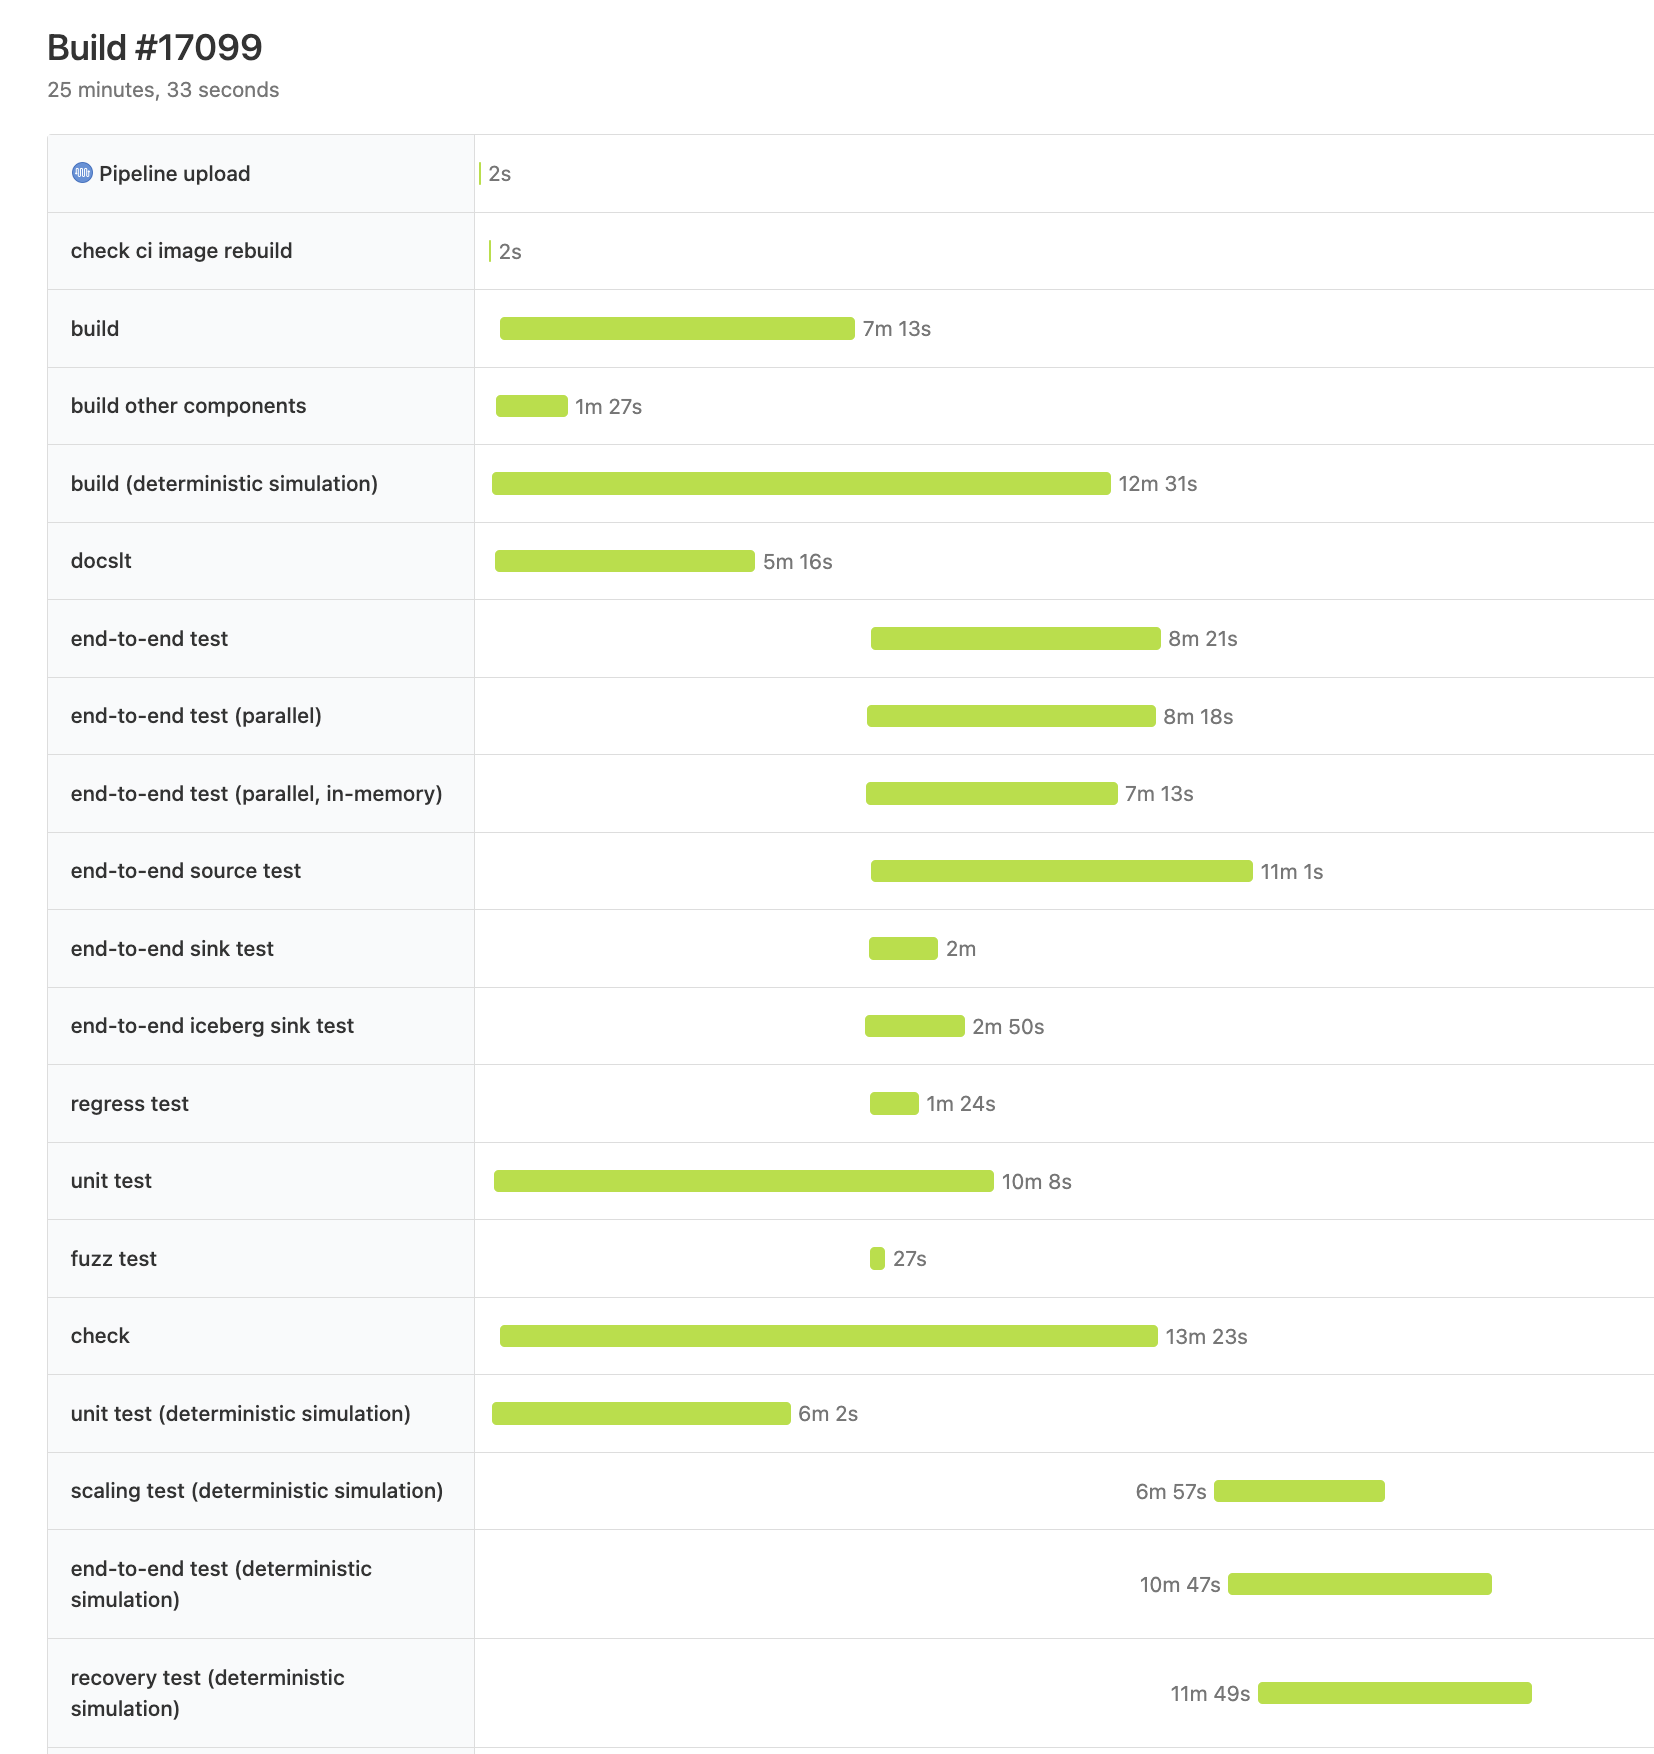
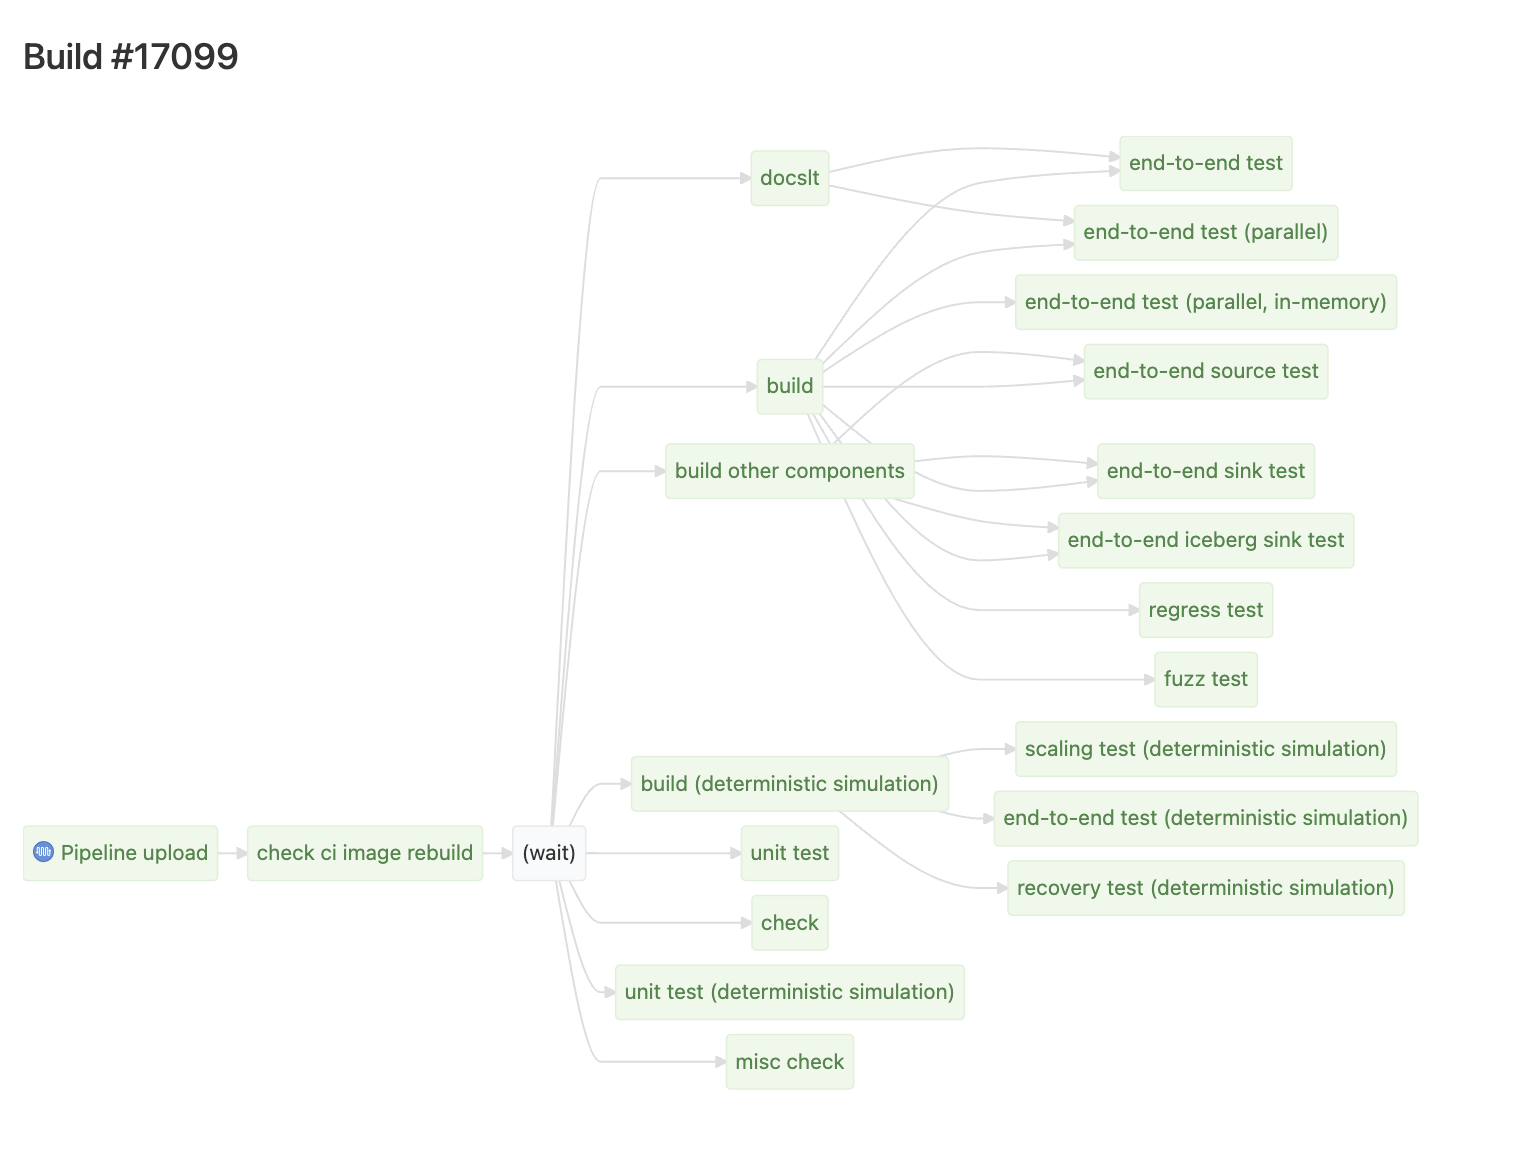
从图上我们可以清晰地看出,最大的瓶颈是 simulation build -> recovery test
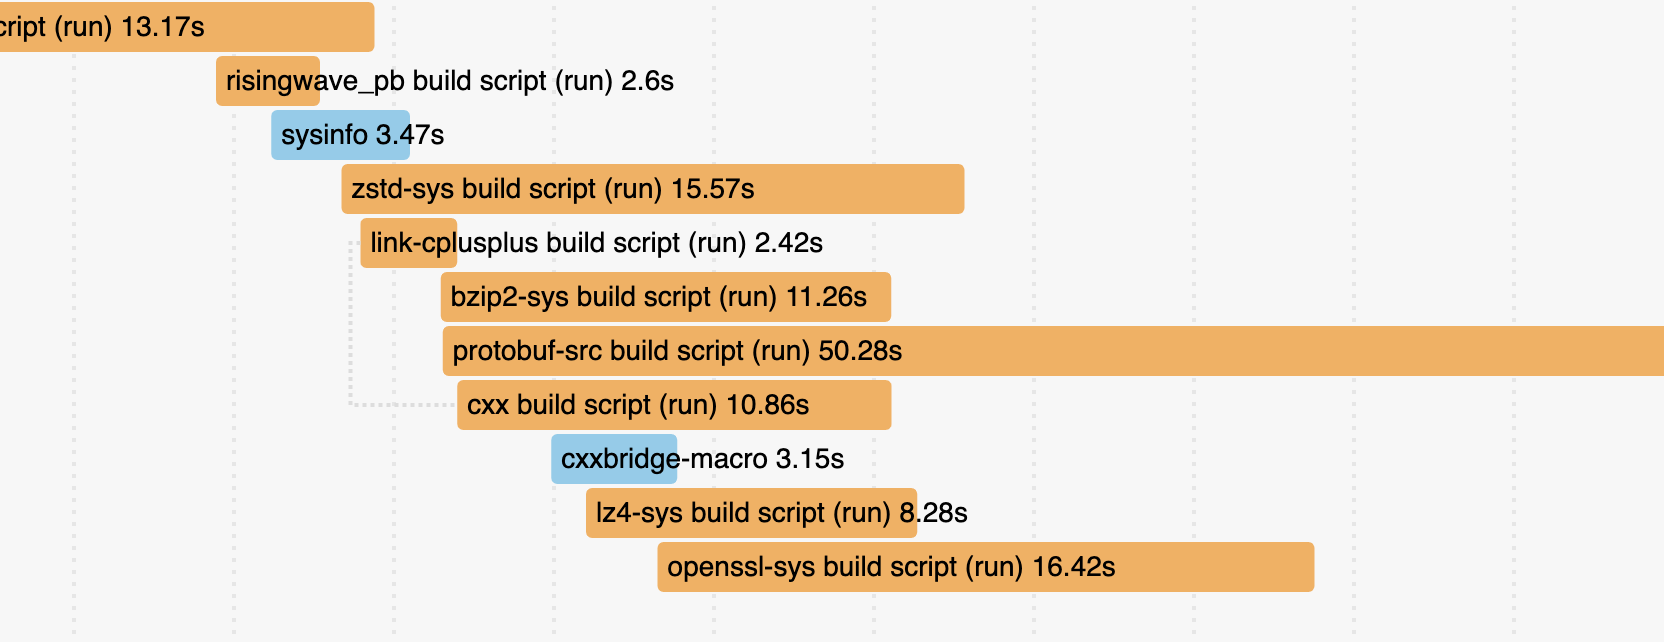
cargo build --timings
Cargo 自带 profiling 编译时间的支持(貌似是去年 stablize 的),通过 cargo build –timings 启用,它长这样:
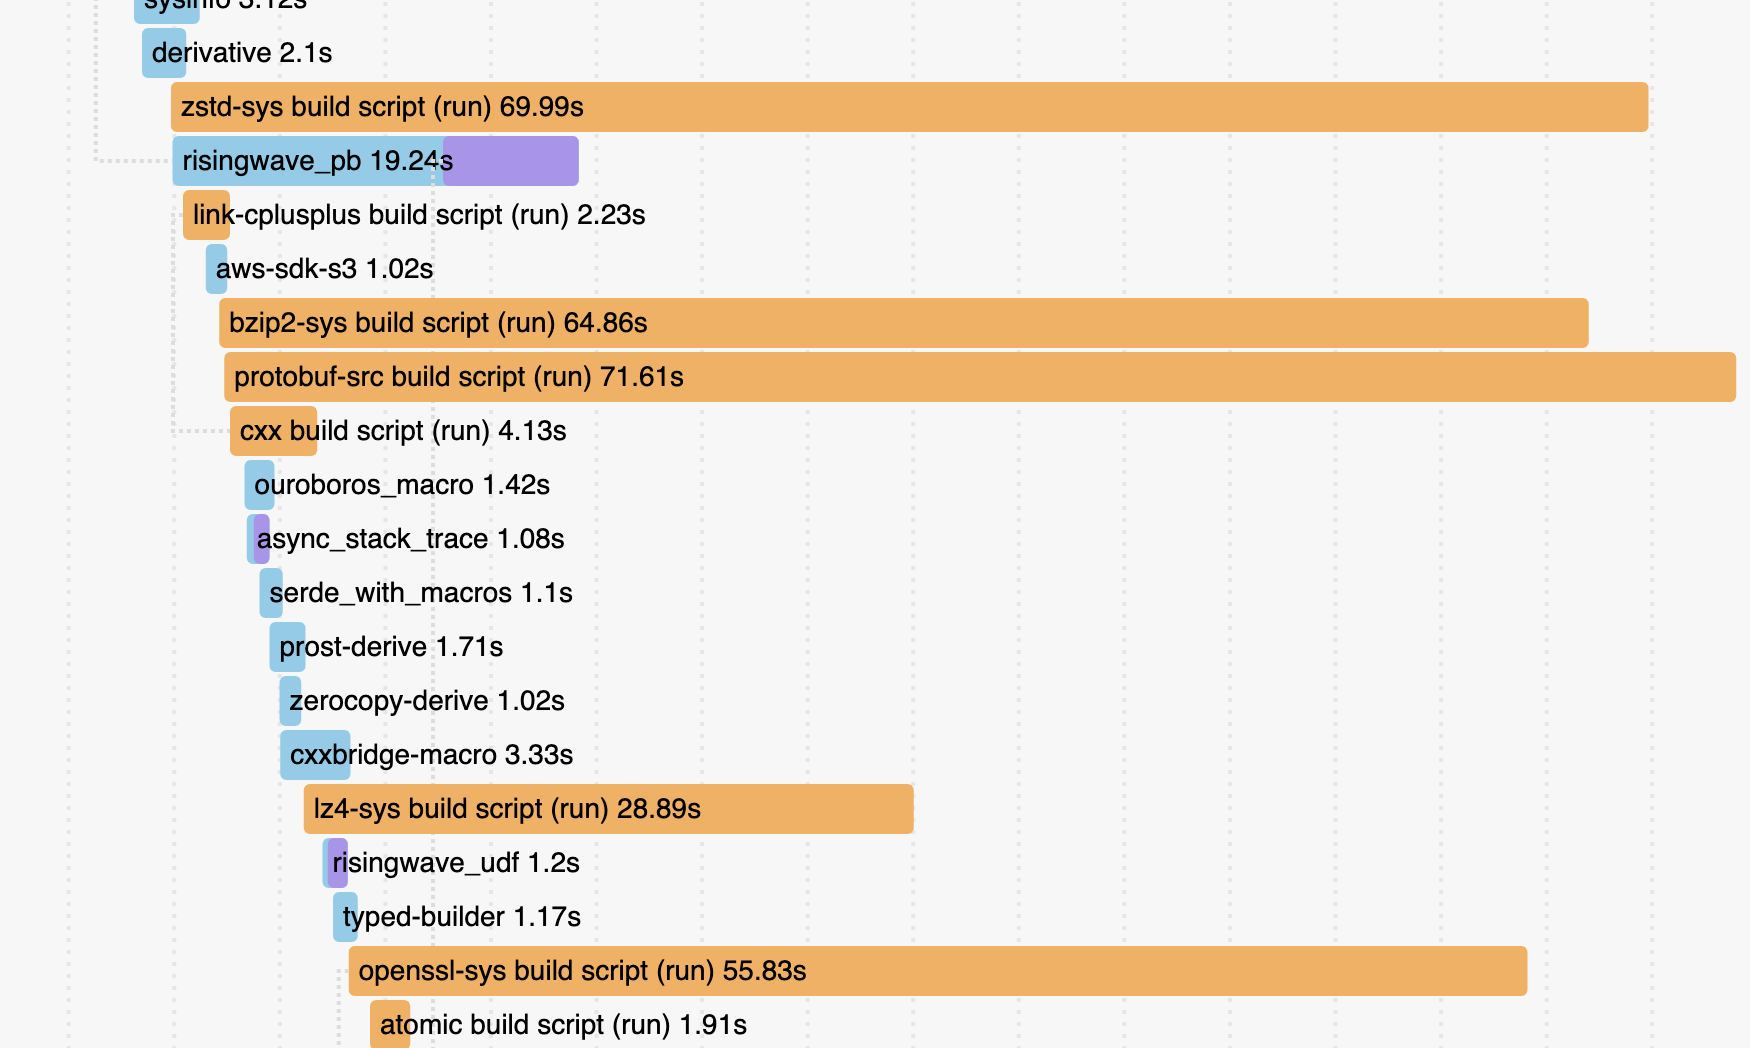
可以发现 zstd-sys , protobuf-src 等几个依赖的编译时间非常长,应该想办法看看能不能优化掉。
Step 1: Compilation cache
If you think about it, it’s pretty obvious how a good caching strategy for CI should work.
Unfortunately, almost nobody does this.
2023-04: 为什么你该试试 Sccache? 在 xuanwo 的大力鼓吹下,我非常心动,也想尝试一下 sccache。这也算是我这次搞优化的一大 trigger。
不用多说,非常简单好用。只需加两个环境变量就一键启动了:
ENV RUSTC_WRAPPER=sccache
ENV SCCACHE_BUCKET=ci-sccache-bucket
(在这背后其实需要研究一下 Buildkite 和 AWS 的配置——实际上也非常傻瓜。Buildkite 可以通过 IAM Role 来获得权限,加一个 S3 bucket 的 policy 就 work 了,完全不用配置 secret key 之类的东西。我之前还在思考能不能在 CI 里把 key echo 出来,看来是完全不用担心这种事😄)
效果立竿见影,simulation build 减少了 2.5min,非瓶颈的 debug build 减少了 4min。虽然并没有质变,但是免费的量变何乐而不为呢?
Step 2: Remove unused dependencies
build: remove unused deps #7816
在 Cargo.toml 中声明的依赖不管实际上有没有用到,都会被编译。更甚它可能会引入不必要的 syncronization point,影响编译的并行度。
有个老工具 cargo-udeps 就是干这个的,但是首先它并不支持自动修复,而且它很慢。另外印象中有一个毛病是它不能和 workspace-hack 一起用。这导致 RisingWave 中长期没有清理过 unused dependencies。典型的破窗效应🥲!
在 cargo-udeps 里关于自动 fix 的 issue 下面看到有人提了 cargo-machete (这个名字是大砍刀的意思🤣),觉得是骡子是马拉出来遛遛,发现它跑的飞快,也没有几个 false postive。虽然有几个小问题(参考上面 PR 的 commit history),但是都能容易地修掉。
大砍刀的作者有一篇 blog 介绍了 unused dependencies 的危害以及 cargo-machete 的解法。具体说来,cargo-udeps 是用 cargo check 先编译了一遍再分析的,而 cargo-machete 是简单粗暴的 ripgrep。
这个 PR 一下子删掉了大几十个 udeps,也是让我大吃一惊🤯。可惜的是,CI 的时间并没有进一步缩短,感觉这侧面说明了 cache 效果很好……我本地粗略地测了一下,大概快了十几二十秒。蚊子腿也是肉嘛,anyway it’s free!
P.S. 其实 cargo-udeps 配一下也是能和 workspace-hack 用的:feat(risedev): add check-udeps #7836
Step 3: Disable incremental compilation
build: disable incremental build in CI #7838
干完上面两个小工作之后本来已经想收工了,但有点心痒痒,觉得 simulation build 还是有点慢。于是我决定 profiling 一下看看。然后就看到了一开始贴的 --timings 的图中的几个庞然大物,我觉得这很不 make sense。
我搜了搜 sccache non-cacheable 的原因,发现 incremental compilation 是个很大的 caveat,立马尝试了一下,然后我再次震惊了,效果 stupidly 好:
这让 simulation build 的时间瞬间下降了 4 分钟……
实际上我们的 debug build 是很早之前就关掉了 incremental compilation:
[profile.ci-dev]
incremental = false
但是后来加上新的 build profile 的时候没有考虑到这个问题。仔细想一想,incremental compilation 虽好,但它在 CI 里不太 make sense 啊!
CI builds often are closer to from-scratch builds, as changes are typically much bigger than from a local edit-compile cycle. For from-scratch builds, incremental adds an extra dependency-tracking overhead. It also significantly increases the amount of IO and the size of
./target, which make caching less effective.
于是我干脆在 CI 里加了个全局的 env var 来把它关掉,一劳永逸。
Step 4: Single binary integration test
build: single-binary integration test #7842
又是一个 stupidly effective 的优化。tl;dr:
Don’t do this:
tests/
  foo.rs
  bar.rs
Do this instead:
tests/
  integration/
    main.rs
    foo.rs
    bar.rs
因为 tests/ 下面的每个文件都会编译成一个单独的 binary(意味着会每个都 link 一下依赖)。除了编译慢,这甚至还可能导致测试跑的慢(cargo test 的缺陷)。
这个优化没有减少我们的测试时间(可能是因为 cargo nextest 的优越性),但它一下子又减少了快 2 分钟的编译时间……另外说来有点可笑的是,它还减少了 2 分钟的 artifacts 上传下载、压缩解压的时间……(虽然后者在瓶颈上并没有影响)
其他一些先前就存在的优化
以上就是我这次优化的主要过程了,这下终于可以心满意足地收工了。最后想再总结一些前人的努力,以供参考。
- 使用
cargo nextest替代cargo test。 - 使用
workspace-hack技术:见cargo hakari。 - 给 cargo registry 加 cache,或者使用刚刚 stablize 的 sparse index,可参考 DCjanus 的这篇 blog。
- 把巨大的 crate 拆分成多个小 create。
- link time 的优化:link 很花时间,而且是单线程的,很可能成为瓶颈
- 使用更快的 linker:
moldfor Linux,zldfor macOS.lldis the most mature option for production use. - 在 debug build 上关掉 Link Time Optimization (LTO)。
- 使用更快的 linker:
- Trade-off between compile time and performance:CI 的总时间是编译+测试,那么编译优化(包括上面的 LTO)开不开,开多少实际上就是在前后者之间 trade-off,可以调整测试来达到一个整体最优的选择。例如 bugen gg 在我们的 build profile 上的骚操作:
# The profile used for CI in pull requests.
# External dependencies are built with optimization enabled, while crates in this workspace are built
# with `dev` profile and full debug info. This is a trade-off between build time and e2e test time.
[profile.ci-dev]
inherits = "dev"
incremental = false
[profile.ci-dev.package."*"] # external dependencies
opt-level = 1
[profile.ci-dev.package."tokio"]
opt-level = 3
[profile.ci-dev.package."async_stack_trace"]
opt-level = 3
[profile.ci-dev.package."indextree"]
opt-level = 3
[profile.ci-dev.package."task_stats_alloc"]
opt-level = 3

# The profile used for deterministic simulation tests in CI.
# The simulator can only run single-threaded, so optimization is required to make the running time
# reasonable. The optimization level is customized to speed up the build.
[profile.ci-sim]
inherits = "dev"
opt-level = 2
incremental = false
除此以外的更多优化也有很多人都总结过,我就不多说(不懂)了,例如这篇 blog:Tips for Faster Rust Compile Times
总结
CI、开发者体验这种东西很容易就会在无人照料的情况下变得杂草丛生,但如果定期打理一下,可能会有意想不到的收获,一点点微小的努力就带来巨大的提升。
最后再摘两段 matklad blog 里的话作结:
Compilation time is a multiplier for basically everything. Whether you want to ship more features, to make code faster, to adapt to a change of requirements, or to attract new contributors, build time is a factor in that.
It also is a non-linear factor. Just waiting for the compiler is the smaller problem. The big one is losing the state of the flow or (worse) mental context switch to do something else while the code is compiling. One minute of work for the compiler wastes more than one minute of work for the human.